Given the robust nature of learning sciences research, this website is best viewed on tablets and computers. A small screen experience is coming in the future.
On June 22, 2021, we will launch updated strategies for the Math PK-2 model, as well as additional updates to the Navigator that highlight equity, SEL, and culturally responsive teaching. To learn more, visit our Site Updates (available in the "About" menu at the top of any page).

Hover to see how factors connect to Visual Processing. Then click connected factors to explore strategies related to multiple factors.
Visual Processing is seeing at the cognitive level: taking the input that comes through our Vision and working to understand what we see. Visual Processing skills help students recognize and order visual information, allowing them to correctly copy and solve math problems and represent and work with geometric shapes. Learners with dyslexia may demonstrate differences with the Visual Processing of words and numbers, often stemming from difficulties with Phonological Awareness, which can disrupt the process of Visual Attention.
Project-based learning (PBL) actively engages learners in authentic tasks designed to create products that answer a given question or solve a problem.
When students explain their thinking process aloud with guidance in response to questions or prompts, they recognize the strategies they use and solidify their understanding.
Flexible grouping is a classroom practice that temporarily places students together in given groups to work together, with the purpose of achieving a given learning goal or activity.
In guided inquiry, teachers help students use their own language for constructing knowledge by active listening and questioning.
A strengths-based approach is one where educators intentionally identify, communicate, and harness students' assets, across many aspects of the whole child, in order to empower them to flourish.
Adding motions to complement learning activates more cognitive processes for recall and understanding.
Communication boards are displays of graphics (e.g., pictures, symbols, illustrations) and/or words where learners can gesture or point to the displays to extend their expressive language potential.
Transforming written text into audio activates different parts of the brain to support learning.
Visual supports, like text magnification, colored overlays, and guided reading strip, help students focus and properly track as they read.
When classrooms are intentionally designed to promote inclusion, belonging, and accessibility, they positively influence key learner factors, including Attention, Self-Regulation, Learner Mindset, and Sense of Belonging.
Math games and manipulatives for vision differences support math development for learners with visual needs.
Continual use of foundational skills with different problems reinforces a conceptual understanding of math skills.
Daily review strengthens previous learning and can lead to fluent recall.
Spending time with new content helps move concepts and ideas into Long-term Memory.
Practicing until achieving several error-free attempts is critical for retention.
Having students verbally repeat information such as instructions ensures they have heard and supports remembering.
By talking through their thinking at each step of a process, teachers can model what learning looks like.
Communication boards are displays of graphics (e.g., pictures, symbols, illustrations) and/or words where learners can gesture or point to the displays to extend their expressive language potential.
Translanguaging is a flexible classroom practice enabling students to listen, speak, read, and write across their multiple languages or dialects, even if the teacher does not have formal knowledge of these additional languages.
 Except where otherwise noted, content on this site is licensed under a Creative Commons Attribution-NonCommercial 4.0 International License
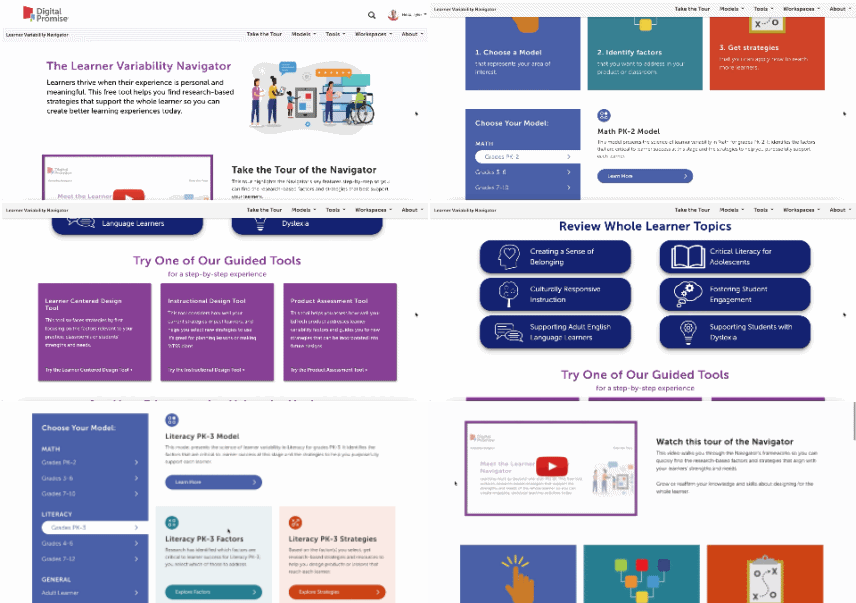
This is our homepage. You can access many of the features of the Navigator here, and learn more about how learner variability intersects with topics in education and learning. To start, select a content area – we call them Learner Models – to visit a factor map.
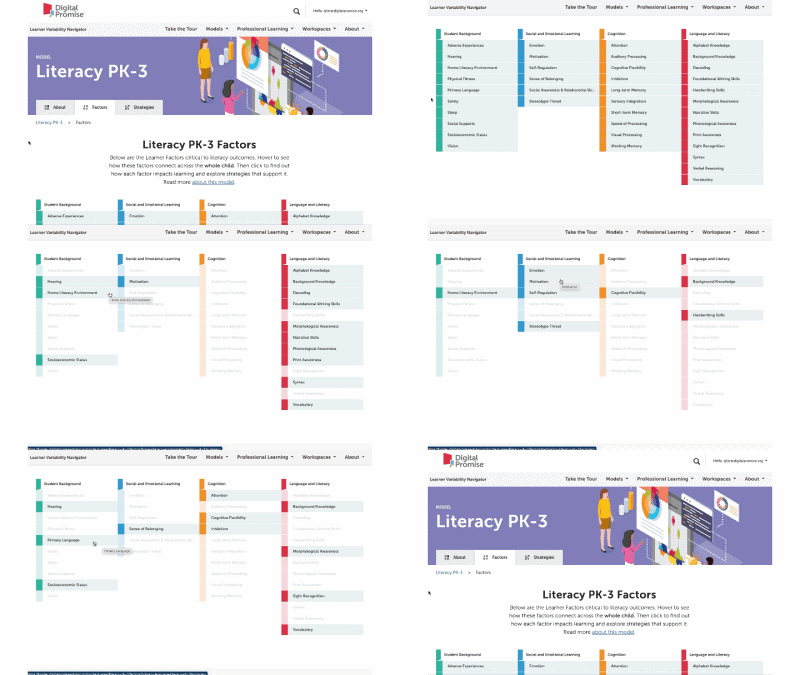
Factor maps show research-based concepts, "factors," that likely impact learning. They are organized into four categories: Learner Background, Social and Emotional Learning, Cognition, and Content Area. The map is interactive. Move your cursor over a factor to see connected factors. Select any factor to visit its summary page. We'll look at factor summary pages next.
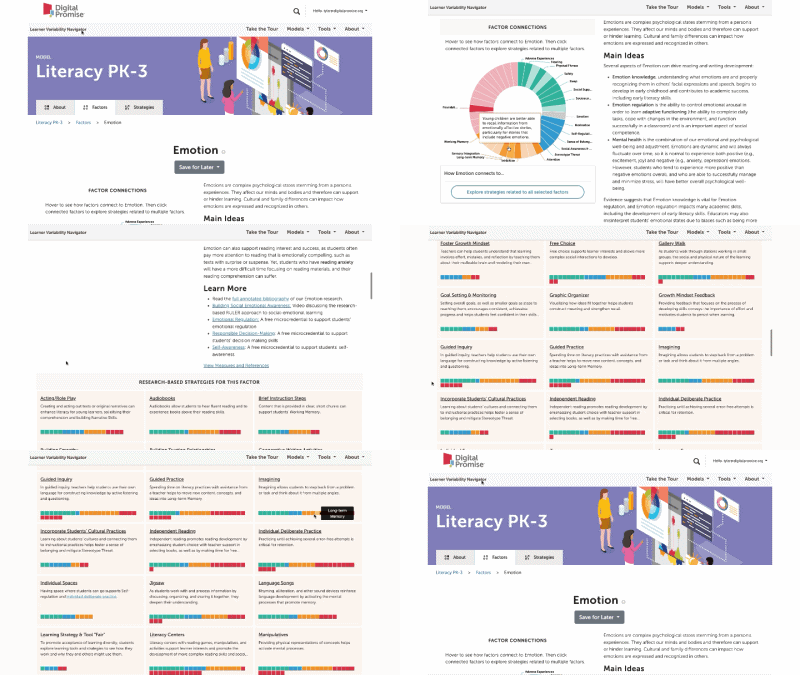
This is a factor summary page. It provides a brief definition and review of the factor, a factor connections diagram, additional resources, and strategies that support this factor. On the strategy card, the multi-colored boxes show all the factors that it supports. Select a strategy to visit its summary page.
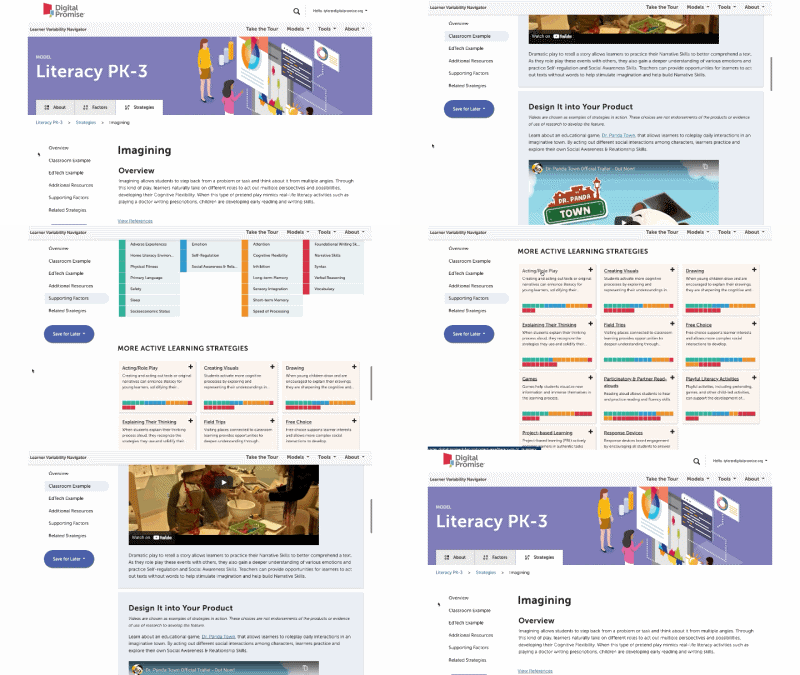
Strategy summary pages have an overview, information about using the strategy in different learning environments, resources of interest, the factors this strategy supports, and related strategies you can explore. To view all the strategies in a content area, use the strategies tab at the top of the page. We'll look at all the Strategies for this learner model next.
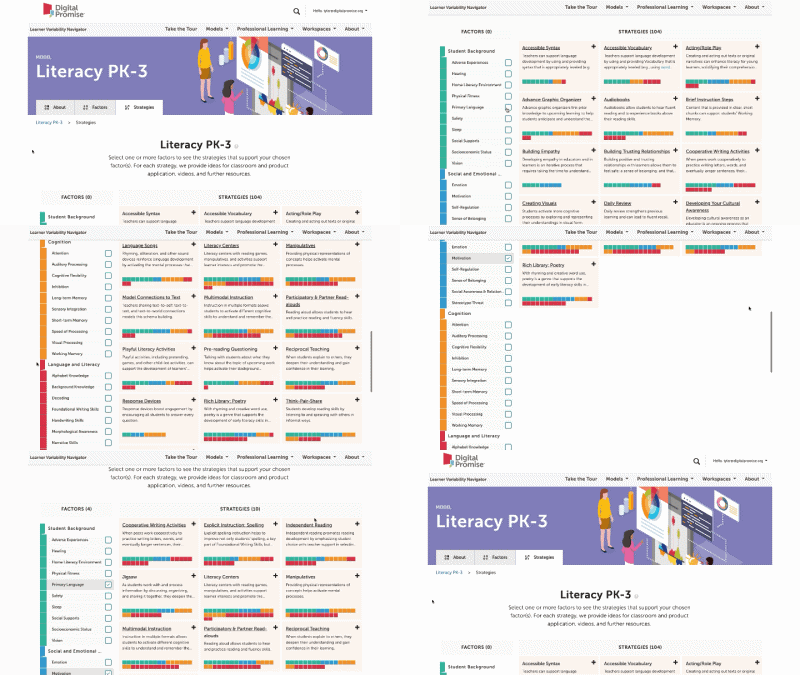
The strategy page shows ALL of the strategies for that learner model. You can select factors of interest for you or your learners, and it will narrow the strategies to only those that match all of the factors selected. This makes it easy to find key strategies to better design for learner variability. Again, select the strategy name to visit its summary page.
Are you sure you want to delete this Workspace?
Enter the email address of the person you want to share with. This person will be granted access to this workspace and will be able to view and edit it.
Adjust the permissions of your Workspace.
This Workspace is .
This Workspace's Reflection Area is .
Learner variability is the recognition that each learner is a unique constellation of strengths and challenges that are interconnected across the whole child. Understanding these connections and how they vary according to context is essential for meeting the needs of each learner.
It disrupts the notion of a one-size-fits all education. Understanding learner variability helps educators embrace both students’ struggles and strengths as we connect practice to uplifting the whole learner.
Throughout the site, we talk about "factors" and "strategies." Factors are concepts research suggests have an impact on how people learn. Strategies are the approaches to teaching and learning that can be used to support people in how they learn best.
Use the Learner Centered Design Tool to build a workspace. Go to Learner Centered Design Tool.
Or, create a new blank workspace for your product or project.
Use one of the guided tools to build a workspace.
Or, create a new blank workspace for your product or project.
Make a copy of this workspace.
Redirecting soon...
Generating summary page
Loading...
On this page, using your heatmap, you will be asked to select factors to further explore, and then select new strategies you might incorporate into upcoming instruction. Once done, click “Show Summary" to view your Design Summary Report.
On this page, using your heatmap, you will be asked to select factors to further explore, and then select new strategies you might incorporate into upcoming instruction. Once done, click “Show Report” to view your Design Summary Report.
By selecting "Show Report" you will be taken to the Assessment Summary Page. Once created, you will not be able to edit your report. If you select cancel below, you can continue to edit your factor and strategy selections.
Announcement here
Item successfully added to workspace!
Issue adding item to workspace. Please refresh the page and try again.
Learner variability is the recognition that each learner is a unique constellation of strengths and challenges that are interconnected across the whole child. Understanding these connections and how they vary according to context is essential for meeting the needs of each learner. It embraces both students’ struggles and strengths. It considers the whole child.
Throughout the site, we talk about "factors" and "strategies." Factors are concepts research suggests have an impact on how people learn. Strategies are the approaches to teaching and learning that can be used to support people in how they learn best.
The Learner Variability Navigator is a free, online tool that translates the science of learner variability into factor maps and strategies that highlight connections across the whole learner. This puts the science of learning at teachers' fingertips, empowering them to understand their own practice and support each learner.